You are here: Cops>Common Web>NewsMedia>M1714 (25 Sep 2020, RaymondLutz)Edit Attach
Roque de la Fuente vote loss analysis
Citizens Oversight (2016-11-16) Roque De La Fuente This Page: https://copswiki.org/Common/M1714More Info: Election Integrity
The voting tallies are attached along with all relevant screenshots. Below are my notes, methodology, analysis, and conclusion. Notes: #1 Data for a greenstate comes from the state's official website. #2 Data for an orangestate comes from Politico.com. #3 This analysis is over the states where De La Fuente was on the ballot.
Methodology: Step 1: Screenshots were taken by 6 different people in 4 different states in 2 different time zones as the results were coming in to individual state websites and Politico.com. Step 2: All screenshots were gathered and entered into the Excel spreadsheet attached based on how "Rocky" Roque De La Fuente's vote totals progressed throughout the night in each state. Step 3: Whenever Mr. De La Fuente's vote totals went down, the screenshot at that moment in time was compared to the previous one taken to pinpoint what county lowered the vote total. If the county information was not captured then the timeframe of the drop in votes was listed. Analysis: #1 Nothing abnormal was found in any data gathered from a state's official website. This includes Alaska, Colorado, Florida, Iowa, Kentucky, Minnesota, Montana and Rhode Island.
#2 Nothing abnormal was found in data gathered from Politico in the following states: Idaho, Minnesota, Mississippi, Montana, Nevada, New Mexico, Rhode Island, Utah, Vermont, Wisconsin and Wyoming.
#3 Florida data from Politico showed two problems. The first is that De La Fuente's vote total dropped from 897 at 39.1% reporting to 124 at 78.1% reporting in St. Lucie County . De La Fuente was the only candidate to lose votes here. The second is that De La Fuente's vote total dropped from 4,188 at 48.2% reporting to 503 at 62.9% reporting in Broward County . De La Fuente was the only candidate to lose votes here. See FL1,2,3,4.
#4 Kentucky data from Politico showed De La Fuente's vote total drop from 105 at 100% reporting to 0 also at 100% reporting in Ohio County . De La Fuente's votes were given to Mc Mullin who jumped from 0 votes to 105. See KY1,2.
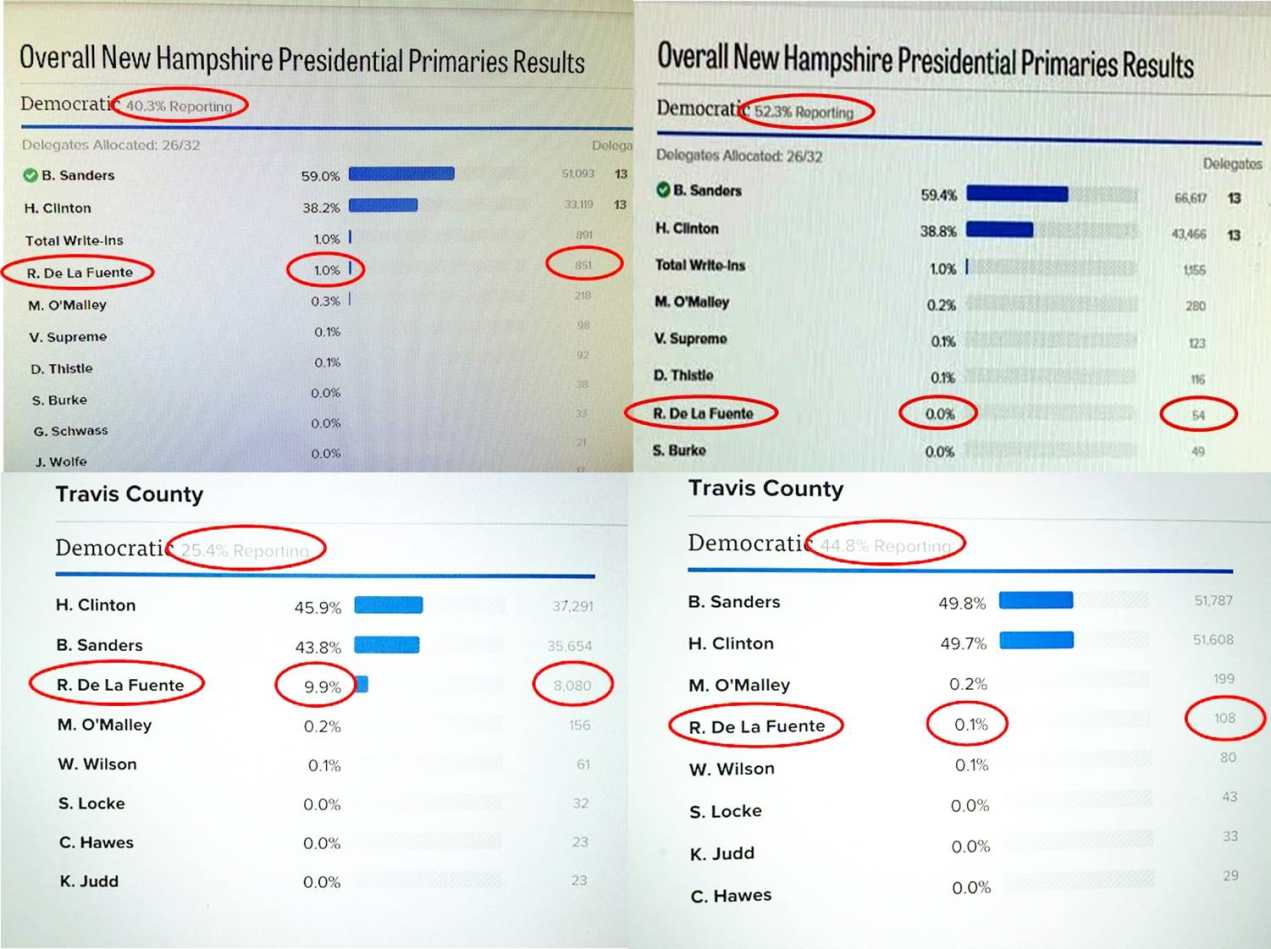
#5 New Hampshire data from Politico showed De La Fuente's vote total dropped from 1,179 at 52.9% reporting to 27 at 70.6% in Sullivan County. De La Fuente was the only candidate to lose votes here. See NH1,2.
#6 New Jersey data from Politico showed De La Fuente's vote total drop from 1,820 at 44.3% reporting to 1,230 at 80.9% reporting overall. De La Fuente was the only candidate to lose votes here. I was unable to determine which county was responsible for this, but I do know it happened between 11:12pm and 12:05am EST. See NH1,2.
#7 North Dakota data from Politico showed De La Fuente's vote total drop from 20 at 100% reporting to 1 also at 100% reporting in Walsh County . Stein, Castle and De La Fuente lost votes here . See ND1,2.
#8 Tennessee data from Politico showed two problems. The first is that De La Fuente's vote total dropped from 533 at 50% reporting to 10 at 100% reporting in Macon County. De La Fuente was the only candidate to lose votes here. The second is that De La Fuente's vote total dropped from 346 at 82.4% reporting to 122 at 98.8% reporting in Knox County. Johnson and De La Fuente were the only candidates to lose votes here. See TN1,2,3,4.
Conclusion: If De La Fuente's campaign wants to challenge the votes tallies, good places to pursue would be: NOTE: Depending on how the website totals were generated, it could have been human error entering the numbers throughout the canvass period.
Broward and St. Lucie Counties, Florida Ohio County, Kentucky Sullivan County, New Hampshire Walsh County, North Dakota Knox and Macon Counties, Tennessee The state of New Jersey, specifically results that were reported between 11:12pm and 12:05am EST
- 12539046-politico-nh-and-tx-vote-fraud.jpg:

Media Form edit
| Title | Roque de la Fuente vote loss analysis |
| Publisher | Citizens Oversight |
| Author | Roque De La Fuente |
| Pub Date | 2016-11-16 |
| Media Link | |
| Remote Link | |
| Embed HTML | |
| Forum Link | |
| Note | |
| Keywords | Election Integrity |
| Related Keywords | |
| Media Type | Article, Pictures |
| Media Group | News |
| Curator Rating | Plain |
| Venue | |
| Book ISBN | |
| Author Name Sortable | |
| Thumbnail Link |
| I | Attachment | Action | Size | Date | Who | Comment |
|---|---|---|---|---|---|---|
| |
12539046-politico-nh-and-tx-vote-fraud.jpg | manage | 92 K | 30 Oct 2018 - 19:56 | Raymond Lutz |
Edit | Attach | Print version | History: r3 < r2 < r1 | Backlinks | View wiki text | Edit wiki text | More topic actions
Topic revision: r3 - 25 Sep 2020, RaymondLutz
 Copyright © by the contributing authors. All material on this collaboration platform is the property of the contributing authors.
 Ideas, requests, problems regarding Cops? Send feedback


