You are here: Cops>Common Web>NewsMedia>M1890 (08 Mar 2019, RaymondLutz)Edit Attach
Rule of Large Numbers in Election Results
Citizens Oversight (2019-03-08) Ray Lutz This Page: https://copswiki.org/Common/M1890More Info: Election Integrity
Recently, I have read a number of documents that claim to have detected likely fraud in an election because the results did not comply with the "law of large numbers (LLN)." For example, we have this recent article on "soapboxie" that claims that the cumulative average indicates that the 2004 election in Ohio between John Kerry and George W. Bush may have been hacked: https://soapboxie.com/us-politics/New-York-Times-John-Kerry-Says-History-Changing-2004-Election-May-Have-Been-Rigged-After-All As you will see, these analyses are unreliable and generally provide no information about any likely fraud. The reason the LLN does not apply is because it only applies to random events, and the order in which precincts are generally processed in any election is not truly random. You can read about the general Law of Large Numbers in this Wikipedia article: https://en.wikipedia.org/wiki/Law_of_large_numbers They provide this example of the average of dice rolls, which is a truly random event. The cumulative average provides the typical form of the curve as each roll is added to the sum. You will note that at first, the average can wiggle quite a bit, and then it settles out to the average.
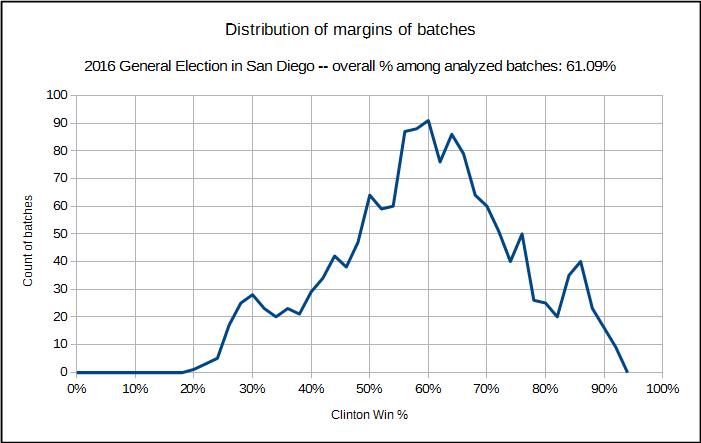
 We can see in that diagram that there are three notable humps, one hump where there were quite a number of precincts where Clinton did poorly, one where she did very well, and then the largest in the middle where it was generally like the final result of 60%. The order in which these are processed is very important.
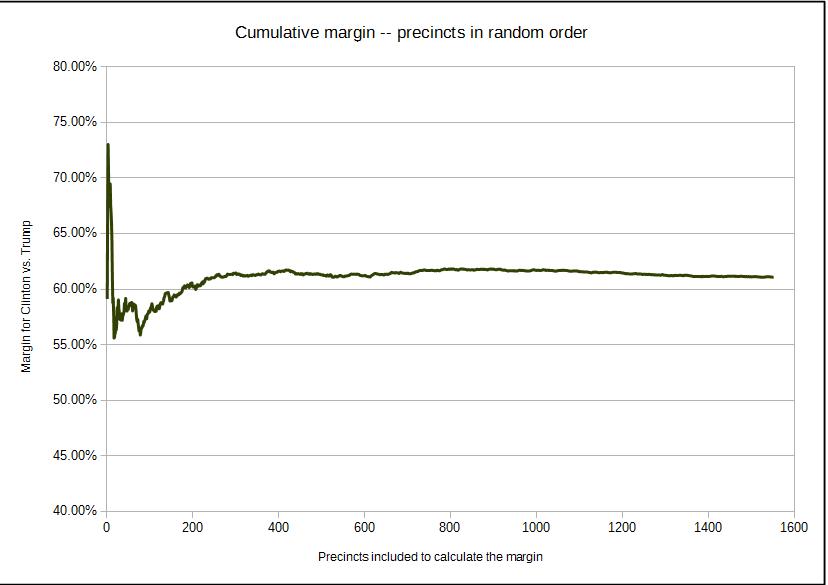
If we draw the precincts at random, then we will get the typical curve as we expect from the LLN.
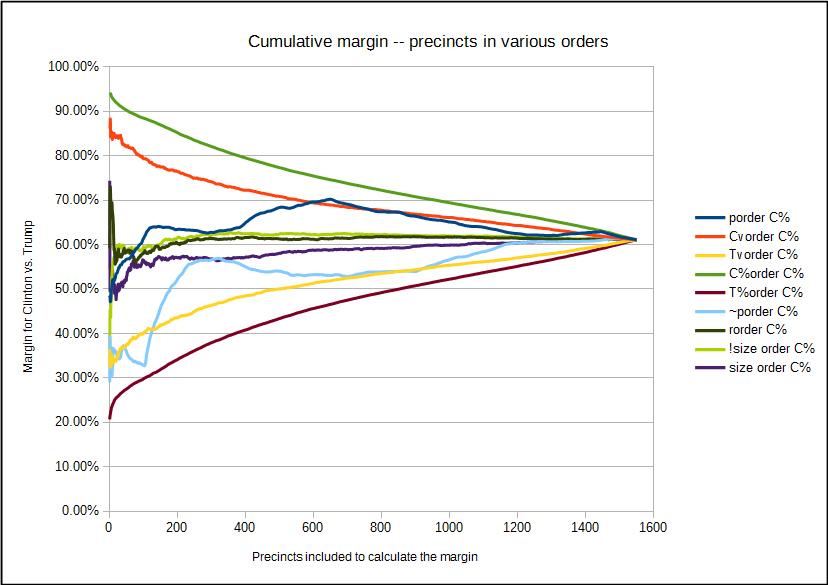
 But if we take the precincts in various orders, then the results are far different, as can be seen below:
 The maximum envelope provided by the top curve and the bottom curve is obtained if the precincts are sorted by the margin for Clinton (light green) or for Trump (violet), and then form the cumulative average. Nothing can ever exceed these bounds.
The next curves "in" from the top and bottom curves provides the result if we sort the precincts by raw maximum vote count for Clinton, from most to least (red) or for Trump (yellow). These are not the same because in a large precinct, the vote count for Clinton might be large, but still smaller than that for Trump, and so this curve will be a bit closer to the true average.
The dark blue curve and the light blue curves provides the cumulative average when the precincts are processed in the official sequence and in reverse. All these would look "suspicous" by many writers, but the wide variation is due not to changing the election, but just changing the order in which the precincts are included in the cumulative average.
The Dark Green curve is the result when the precincts are sampled randomly, as provided earlier.
Many of the analyses of such cumulative margins runs from large precincts to smaller precincts or the reverse. It all depends on how they are distributed. In this plot, if the cumulative sum is performd from large precincts to smaller precincts, that is the very light green curve which is most like the randomly sampled precincts curve (dark green), and when performed from small precincts to large precincts, we get the purple curve.
In this case, using the total size of the precinct in votes cast is the closest to mimicing the random selection IN THIS CASE but in other election districts, the size of the districte just might be correlated with precincts that will vote for one candidate vs. another.
Thus, those who attempt to analyze the trends of the cumulative sum when the precincts are not sampled randomly should not be surprised by the sort of wiggling of the curves you see here, and it does not mean the election has been hacked. Indeed the various curves you see here are for the SAME election results simply processed in different orders.
This is NOT a reliable approach from a statistical standpoint to detect election hacking or manipulation.
--Ray Lutz
Media Form edit
| Title | Rule of Large Numbers in Election Results |
| Publisher | Citizens Oversight |
| Author | Ray Lutz |
| Pub Date | 2019-03-08 |
| Media Link | |
| Remote Link | |
| Embed HTML | |
| Forum Link | |
| Note | |
| Keywords | Election Integrity |
| Related Keywords | |
| Media Type | |
| Media Group | News |
| Curator Rating | Plain |
| Venue | |
| Book ISBN | |
| Author Name Sortable | |
| Thumbnail Link |
| I | Attachment | Action | Size | Date | Who | Comment |
|---|---|---|---|---|---|---|
| |
Cumulative Average of Precincts in random order.jpg | manage | 31 K | 08 Mar 2019 - 02:50 | Raymond Lutz | |
| |
Cumulative Average of Precincts in various orders.jpg | manage | 49 K | 08 Mar 2019 - 02:46 | Raymond Lutz | |
| |
Distribution of margins in San Diego 2018-11 elections.jpg | manage | 35 K | 08 Mar 2019 - 02:52 | Raymond Lutz | Distribution of margins in precincts in San Diego 2016 November election |
| |
WikipediaExampleOfLLN.JPG | manage | 46 K | 08 Mar 2019 - 01:56 | Raymond Lutz | Graphic from Wikipedia Article |
Edit | Attach | Print version | History: r1 | Backlinks | View wiki text | Edit wiki text | More topic actions
Topic revision: r1 - 08 Mar 2019, RaymondLutz
 Copyright © by the contributing authors. All material on this collaboration platform is the property of the contributing authors.
 Ideas, requests, problems regarding Cops? Send feedback


