
Climate Change
This Page: copswiki.org/Common/ClimateChange
See also: EnergyPolicy
Summary of Popular Climate Theory
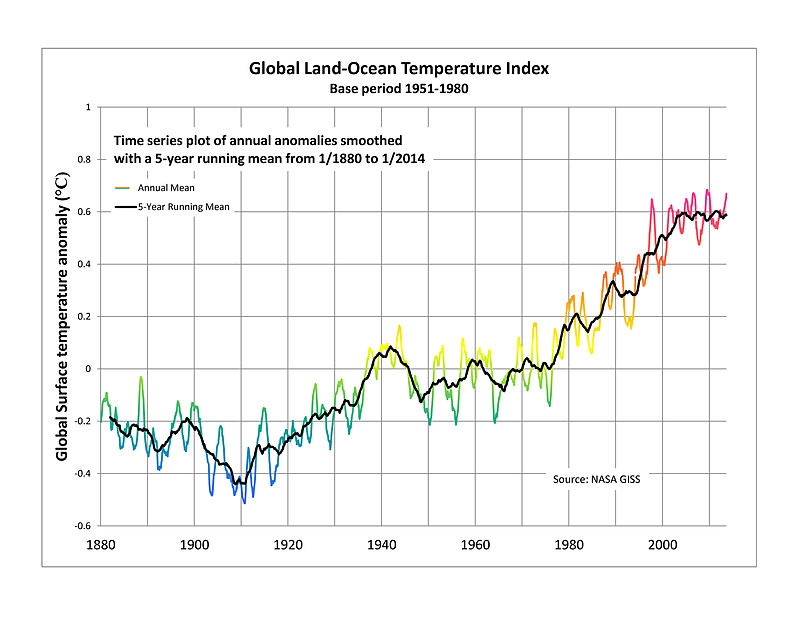 ### Warming trend
First, we take a look at a plot of global temperature 1880. There is a clear warming trend, although in the mid 1940s the climate was cooler for a while, and in recent years, it has flattened. But overall, the trend is nearly monotonic.
### Warming trend
First, we take a look at a plot of global temperature 1880. There is a clear warming trend, although in the mid 1940s the climate was cooler for a while, and in recent years, it has flattened. But overall, the trend is nearly monotonic. |
 ### Greenhouse Effect Basics
The leading theory is based on the "Greenhouse Effect. Increased greenhouse gases (GHG), such as Carbon Dioxide (CO2) theoretically results in an increase in temperature. Solar energy goes in but is kept in due to the blanket-like action of those GHG.
### Greenhouse Effect Basics
The leading theory is based on the "Greenhouse Effect. Increased greenhouse gases (GHG), such as Carbon Dioxide (CO2) theoretically results in an increase in temperature. Solar energy goes in but is kept in due to the blanket-like action of those GHG. |
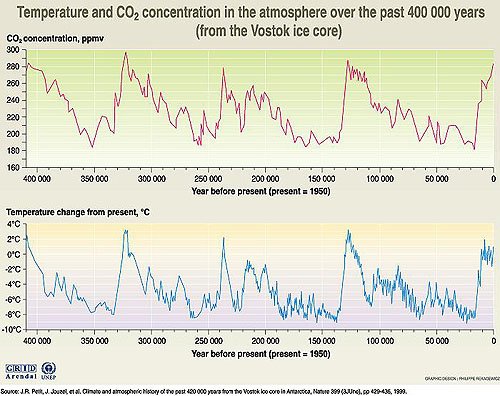 ### CO2 and Temperature Synchronization
It is pretty clear that temperature and CO2 move in unison over historical record of about 400,000 years. Some people say that it appears that CO2 "follows" the temperature curve (higher CO2 results from higher temperature) rather than the more popular idea that the temperature follows CO2 levels. But this may also be due to the way the data was gathered.
### CO2 and Temperature Synchronization
It is pretty clear that temperature and CO2 move in unison over historical record of about 400,000 years. Some people say that it appears that CO2 "follows" the temperature curve (higher CO2 results from higher temperature) rather than the more popular idea that the temperature follows CO2 levels. But this may also be due to the way the data was gathered. |
 ### Hottest Decade on Record
Climate science is relatively new and there are still many questions to be answered. But no one really resists the concept that a warming trend does exist. We may see temperature ups and downs, but the recent decade was the hottest one in our recent records.
Those companies that wish to continue to pollute will push against the realization that human activities do impact the climate and is definitely at least a contributor to the global warming trends. There is a overwhelming scientific consensus that human caused emissions, so-called "anthropogenic" emissions are the most important forcing cause of climate change. But there is an orchestrated agenda to undermine this consensus by the "denier" crowd. For more details, start with this lecture, presenting an excellent historical overview of the established scientific consensus that global warming exists, and it is driven by green-house gases produced by burning fossil fuels.
-
### Hottest Decade on Record
Climate science is relatively new and there are still many questions to be answered. But no one really resists the concept that a warming trend does exist. We may see temperature ups and downs, but the recent decade was the hottest one in our recent records.
Those companies that wish to continue to pollute will push against the realization that human activities do impact the climate and is definitely at least a contributor to the global warming trends. There is a overwhelming scientific consensus that human caused emissions, so-called "anthropogenic" emissions are the most important forcing cause of climate change. But there is an orchestrated agenda to undermine this consensus by the "denier" crowd. For more details, start with this lecture, presenting an excellent historical overview of the established scientific consensus that global warming exists, and it is driven by green-house gases produced by burning fossil fuels.
- |
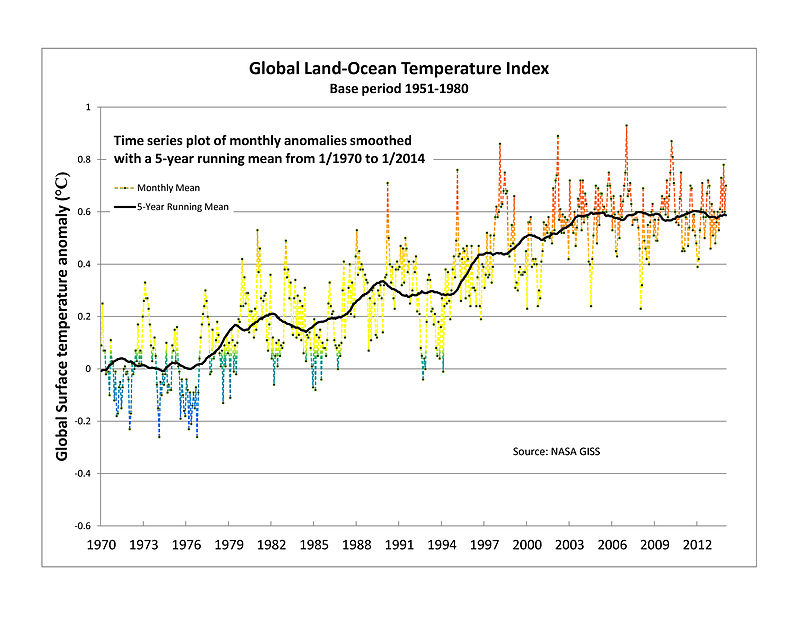 ### Plot of Warming since 1970
The plot of global surface temperatures since 1970 clearly shows a flattening of the curve in recent years, drawing claims that we are experiencing a "pause" in the trend predicted due to GHG emissions, which are off the charts.
### Plot of Warming since 1970
The plot of global surface temperatures since 1970 clearly shows a flattening of the curve in recent years, drawing claims that we are experiencing a "pause" in the trend predicted due to GHG emissions, which are off the charts. |
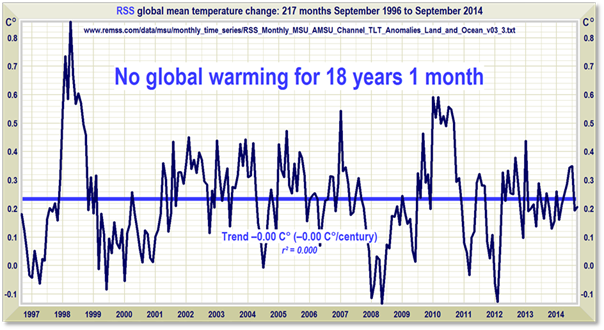 ### A Pause?
By carefully selecting the starting point, recent data can be viewed in isolation to seem to show a pause in warming. Indeed, this was unexpected.
### A Pause?
By carefully selecting the starting point, recent data can be viewed in isolation to seem to show a pause in warming. Indeed, this was unexpected. |
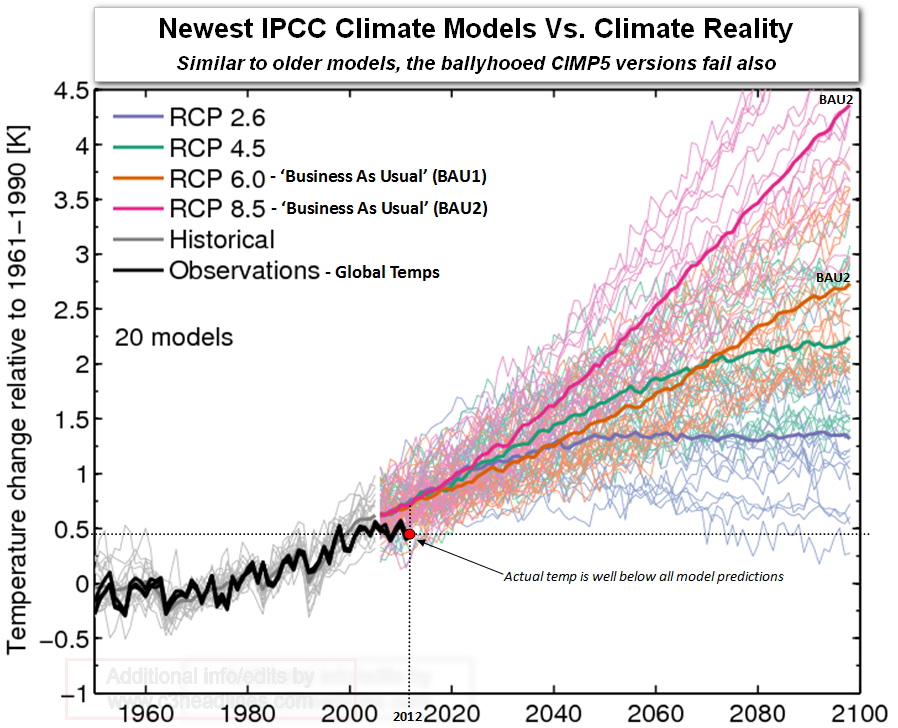 ### IPCC Climate Models vs. Observed
The recent "pause" in the expected warming is now in stark variance with estimates of the temperature as proposed by IPCC Climate Models. However, these climate models are only rough estimates using if-then scenarios. Many scientists are now proposing that the oceans play a much larger role in absorbing the heat, as well as the energy absorbed by melting glaciers and the ice in Greenland and the arctic. These theories still need to be included in the models so they will accurately model the "pause" being seen. Several papers now state that although we are experiencing a pause, it likely will not happen again for many decades.
### IPCC Climate Models vs. Observed
The recent "pause" in the expected warming is now in stark variance with estimates of the temperature as proposed by IPCC Climate Models. However, these climate models are only rough estimates using if-then scenarios. Many scientists are now proposing that the oceans play a much larger role in absorbing the heat, as well as the energy absorbed by melting glaciers and the ice in Greenland and the arctic. These theories still need to be included in the models so they will accurately model the "pause" being seen. Several papers now state that although we are experiencing a pause, it likely will not happen again for many decades. |
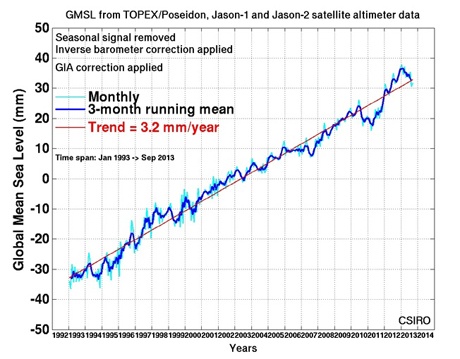 ### Sea Level Increasing monotonically
The sea level is increasing on a monotonic basis, largely due to expansion of the water due to increased temperatures, rather than due to additional water added from melting inland ice. Arctic ice or ice berg melting does not add to the sea level as this ice is floating, whereas ice melting from inland Antarctica and Greenland will add to sea levels.
### Sea Level Increasing monotonically
The sea level is increasing on a monotonic basis, largely due to expansion of the water due to increased temperatures, rather than due to additional water added from melting inland ice. Arctic ice or ice berg melting does not add to the sea level as this ice is floating, whereas ice melting from inland Antarctica and Greenland will add to sea levels. |
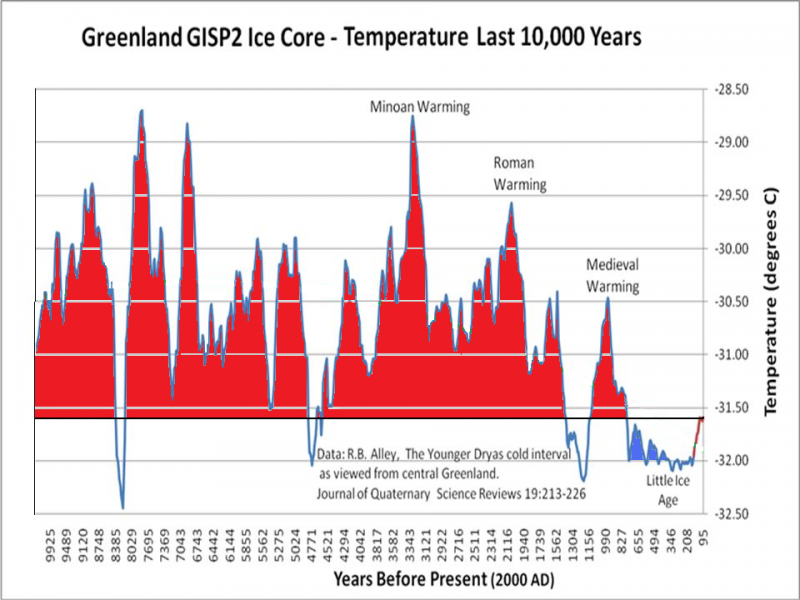 ### Longer global climate history
Scientists have reconstructed global temperatures over a 10,000 year period from Greenland ice cores. Surprisingly, it shows that we are in a relatively cold period.
### Longer global climate history
Scientists have reconstructed global temperatures over a 10,000 year period from Greenland ice cores. Surprisingly, it shows that we are in a relatively cold period. |
| - Warming trends for 2000 years: 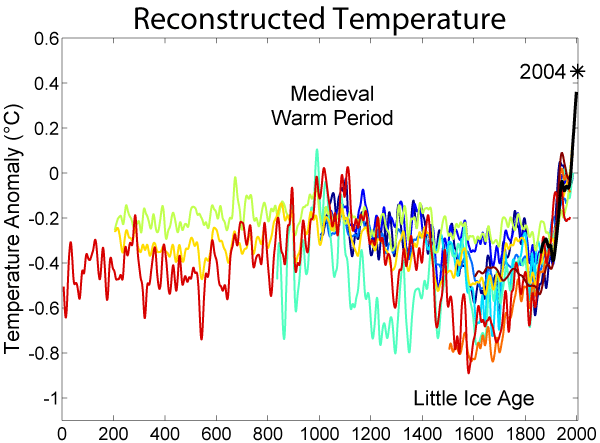 - Climate history for about 4000 years:
  - History of climate change since the last major ice age.:
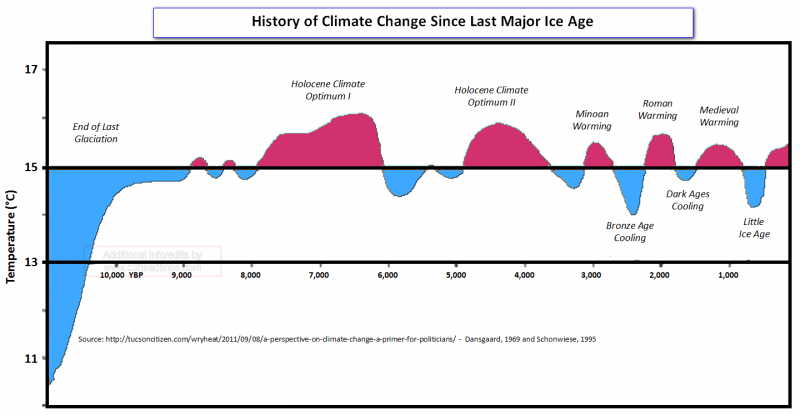
|
 ### What is driving this?
The major scientific theory is that greenhouse gases are driving climate change. There is widespread agreement among climate scientists that these emissions are driving climate change. Of course there are many who disagree with this theory, and it can be argued that they are underwritten by the fossil fuel industry. But for the purposes of this article, we will go along with the leading theory. What is driving the use of fossil fuels, and do we have a hope of reducing it?
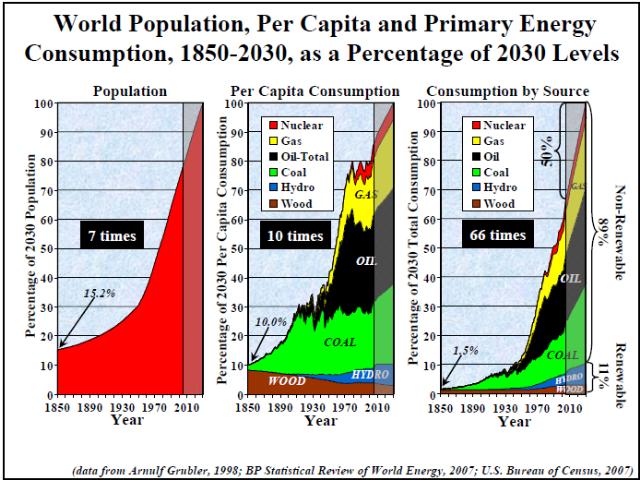
The primary drivers of increases in fossil fuel use is the increase in world population and the increases in per-capita energy use. The result is that in recent decades, the population has increased seven times over, and the use per-capita has increased nearly 10 times, resulting in use up by 66 times. There is no end in sight to the population surge but this will wind up being the most important single issue in the future for many reasons in addition to energy use. Family planning, contraceptives, and safe and easily available abortions will all be essential. Increases in women's rights tends to also result in smaller families.
In terms of per-capita energy use, much of the increase is due to the undeveloped world increasing their use of energy. Highly developed areas, such as California, have remained flat in terms of energy use in recent years. So once undeveloped areas start to use energy, they main driver will then continue to be the population.
### What is driving this?
The major scientific theory is that greenhouse gases are driving climate change. There is widespread agreement among climate scientists that these emissions are driving climate change. Of course there are many who disagree with this theory, and it can be argued that they are underwritten by the fossil fuel industry. But for the purposes of this article, we will go along with the leading theory. What is driving the use of fossil fuels, and do we have a hope of reducing it?
The primary drivers of increases in fossil fuel use is the increase in world population and the increases in per-capita energy use. The result is that in recent decades, the population has increased seven times over, and the use per-capita has increased nearly 10 times, resulting in use up by 66 times. There is no end in sight to the population surge but this will wind up being the most important single issue in the future for many reasons in addition to energy use. Family planning, contraceptives, and safe and easily available abortions will all be essential. Increases in women's rights tends to also result in smaller families.
In terms of per-capita energy use, much of the increase is due to the undeveloped world increasing their use of energy. Highly developed areas, such as California, have remained flat in terms of energy use in recent years. So once undeveloped areas start to use energy, they main driver will then continue to be the population.
|
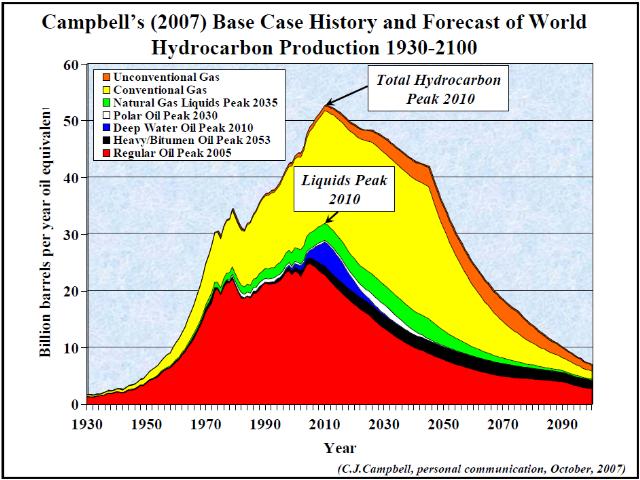 ### Fossil Fuels Face Depletion
Experts disagree on the exact date, but over the next decades, we will face the depletion of many sources of fossil fuels. In recent years, we have seen new technologies, such as "fracking" which can remove additional natural gas from wells that were previously believed to be depleted. This practice has many drawbacks, and is poorly regulated in terms of the chemicals used in the toxic mix injected in these wells to release additional gas, and there has been linkages to increased earthquakes in those areas. Thus, getting the last few drops of oil, puffs of gas, and blocks of coal, will have substantial negative impacts on the environment.
But regardless of the exact date, there is no question that eventually we will deplete resources, at least to the extent that it costs more energy to extract it than we get out. When that happens, it is not worth taking the fuel out of the ground. The chart shown here is an estimate from experts on the likely curve of production of fossil fuels. As we go past "peak oil" and go down the downside of the curve, the cost goes up accordingly.
### Fossil Fuels Face Depletion
Experts disagree on the exact date, but over the next decades, we will face the depletion of many sources of fossil fuels. In recent years, we have seen new technologies, such as "fracking" which can remove additional natural gas from wells that were previously believed to be depleted. This practice has many drawbacks, and is poorly regulated in terms of the chemicals used in the toxic mix injected in these wells to release additional gas, and there has been linkages to increased earthquakes in those areas. Thus, getting the last few drops of oil, puffs of gas, and blocks of coal, will have substantial negative impacts on the environment.
But regardless of the exact date, there is no question that eventually we will deplete resources, at least to the extent that it costs more energy to extract it than we get out. When that happens, it is not worth taking the fuel out of the ground. The chart shown here is an estimate from experts on the likely curve of production of fossil fuels. As we go past "peak oil" and go down the downside of the curve, the cost goes up accordingly. |
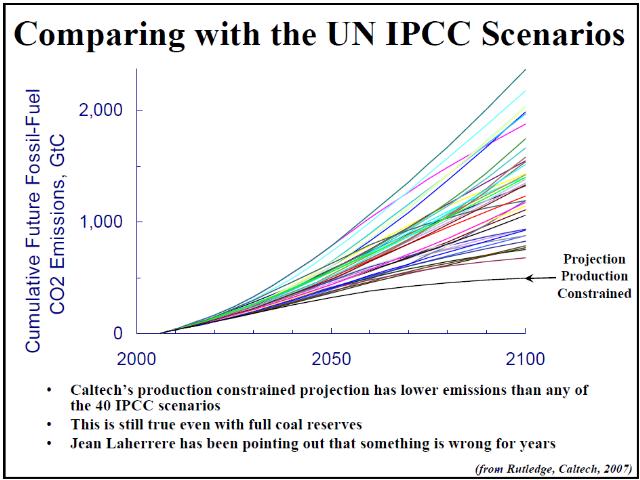 ### Resource Depletion Not Included In Climate Models.
As climate models are if-then scenarios, they do not necessarily include the fact of fossil fuel depletion mentioned above. Although running out of those fuels sounds like a really bad thing, it is a good thing when it comes to the outlook of climate change. When CalTech included resource depletion in climate models, the curve, at the bottom, is much "better" than any of the other climate models whci assume we have unlimited fossil fuel supplies. Thus, climate change will only get so bad, even if we use up all fossil fuels that are economically viable to produce. But it will still be significant.
### Resource Depletion Not Included In Climate Models.
As climate models are if-then scenarios, they do not necessarily include the fact of fossil fuel depletion mentioned above. Although running out of those fuels sounds like a really bad thing, it is a good thing when it comes to the outlook of climate change. When CalTech included resource depletion in climate models, the curve, at the bottom, is much "better" than any of the other climate models whci assume we have unlimited fossil fuel supplies. Thus, climate change will only get so bad, even if we use up all fossil fuels that are economically viable to produce. But it will still be significant.
|
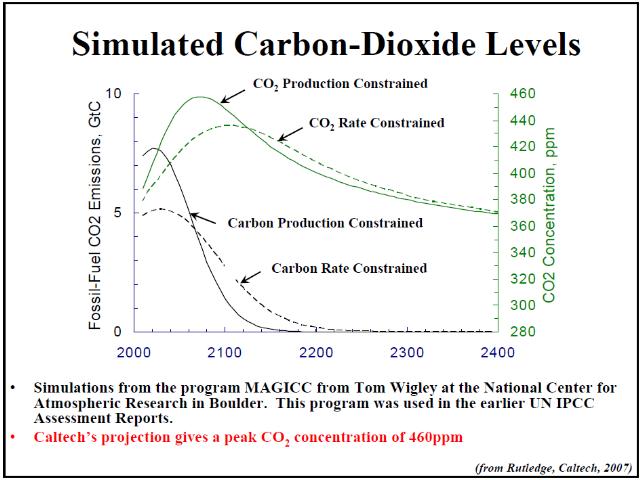 ### CO2 Levels Kept down
Given the natural limit to the fossil fuels available, CO2 levels only go so high. If we struggle to limit fossil fuel use now, the curves are held down a bit and the implications of climate change can be mitigated somewhat. However, if we are unsuccessful in making those changes, then the fact that fossil fuels are limited keep CO2 levels down in these simulations.
Please understand that all these climate models are FAR FROM COMPLETE and are nearly impossible to get right because our climate is very complex.
### CO2 Levels Kept down
Given the natural limit to the fossil fuels available, CO2 levels only go so high. If we struggle to limit fossil fuel use now, the curves are held down a bit and the implications of climate change can be mitigated somewhat. However, if we are unsuccessful in making those changes, then the fact that fossil fuels are limited keep CO2 levels down in these simulations.
Please understand that all these climate models are FAR FROM COMPLETE and are nearly impossible to get right because our climate is very complex. |
We have one of the best sources for fighting global warming literally in our backyards. Plants, particularly trees, absorb carbon dioxide and provide us with clean oxygen to breathe. Some experts believe that a contributing factor to global warming is that we have cut down so many of our trees and forests for industry. By supporting foundations and organizations that protect forests and encouraging sustainable logging practices, you can help bring our planet's temperature down. Don't forget, however, that you can help the fight against global warming all on your own, and even get a new hobby out of the effort.
Gardening is a healthy activity and a fun way to make your home or community beautiful. One tree will absorb over 2000 lbs (906 kg) of carbon dioxide over its lifetime, preventing that gas from getting into the atmosphere. If you have room to plant a tree in your yard, try to do so. Remember, even if all you have space for is a window box, most plants are beneficial to the air and help absorb carbon dioxide and create oxygen. If you can, use organic soil and fertilizer, as harmful chemicals may damage the environment, and actually add to the greenhouse gas problem.
According to EarthSky Communications, Inc. a car in the U.S. on average puts out 7,700 Kg of Co2 (16,940lbs) a year.
A. pretty interesting site with daily astronomical and terrestrial weather: http://suspicious0bserver.org Here is a typical attempt by opponents to the scientific consensus to generate a sense that there is still widespread debate. It asserts that global warming is due only to sun variation, and its credibility is under question.
-
 GreatGlobalWarmingSwindle Great Global Warming Swindle -- Martin Durkin Martin Durkin
 -
Discussion of how random cloud effects may look like positive feedback but really are not: http://climatesci.colorado.edu/2007/08/14/positive-feedback-have-we-been-fooling-ourselves-by-roy-spencer
- Book I want to get: "Human Impacts on Weather and Climate" - http://www.cambridge.org/catalogue/catalogue.asp?isbn=9780521600569
The following paper is very important as it systematically refutes the primary claim in the GreatGlobalWarmingSwindle
- RoyalSocietyPaperOnSolarActivityVsClimateChange.pdf: The Royal Society: "Recent oppositely directed trends in solar climate forcings and the global mean surface air temperature " Lockwood & Frolich
In this paper, the researchers studied the abundances of two isotopes, C-14 and Be-10, both of which are created with interaction with cosmic rays. The paper claims that the source of the two elements (tree trunks and ice sheets or ocean sediments) is very different but they show a correlation. Since the primary source of Cosmic Ray flux is the sun, these elements can be used to provide a history of solar variability.
The conclusion of this paper states:
There are many interesting palaeoclimate studies that suggest that solar variability had an influence on pre-industrial climate. There are also some detection--attribution studies using global climate models that suggest there was a detectable influence of solar variability in the first half of the twentieth century and that the solar radiative forcing variations were amplified by some mechanism that is, as yet, unknown. However, these findings are not relevant to any debates about modern climate change. Our results show that the observed rapid rise in global mean temperatures seen after 1985 cannot be ascribed to solar variability, whichever of the mechanisms is invoked and no matter how much the solar variation is amplified.
Recent Articles and Media: (Add | All Media)
 M1268 2011-10-29 Why do tornados and hailstorms rest on weekends? -- Daniel Rosenfeld, Thomas L. Bell JOURNAL OF GEOPHYSICAL RESEARCH, VOL. 116
  M1177 2011-04-04 The Machinery of Climate Anti-Science -- John R Mashey
 - M877 2009-10-27 Statisticians reject global cooling -- SETH BORENSTEIN AssociatedPress
- M852 2009-09-23 Taking a bite out of climate data -- Patrick J. Michaels National Review Online
 M855 2009-06-20 On the Rates of Sea Level Rise -- Clues from the distant past -- Wolfgang Berger Scripps Institution Of Oceanography
 - M658 2008-10-13 Foreign Liquefied Natural Gas -- Amita Sharma Amy Isackson KpbsNews
- M635 2008-09-11 Drilling – Fool's Gold -- RaymondLutz EastCountyCalifornian
- M719 2007-12-20 The American Denial of Global Warming -- Naomi Oreskes, Ph.D. Ucsd Tv
- M657 2007-09-24 Biofuels: The Science of Creating Greener Energy -- Ucsd Tv Molecules For The Media
- M147 2007-08 Global Warming: Man-Made or Natural? -- SFred Singer Hillsdale College
- M77 2007-07-19 Climate trail goes cold at sun? -- Warming concerns not linked to star -- Brian Handwerk UnionTribune
- M677 2007-07-15 Cadem Resolution: Support Clean Energy -- Dante Atkins, delegate, 42nd Assembly District, Andrew Lachman; Democrats for Israel Los Angeles Cadem Resolutions Committee
- M678 2007-07-15 Cadem Resolution: Opposing Coal Liquefaction -- Dante Atkins, DSCC Member, AD-42, and Platform Committee Member Cadem Resolutions Committee
- M680 2007-07-15 Cadem Resolution: Local Planning to End Global Warming -- Luke Breit, Chair, CDP Environmental Caucus Cadem Resolutions Committee
- GreatGlobalWarmingSwindle Great Global Warming Swindle -- Martin Durkin Martin Durkin